
Picture the accounts payable team at a mid-market company. Several people spend part of every week keying invoices from PDFs into the finance system. The team lead knows it’s the wrong use of their time, and she has a case for fixing it. She takes it to the budget review.
The CFO reads the first slide and asks three questions. Where did the hours come from? Why that percentage? And when does this show up in the cash? If the answers are “a rough guess,” “the vendor’s figure” and “straight away,” the case is finished before the second slide.
In the first post in this series, we argued that AI stalls for business reasons, and that one of the biggest is the missing baseline. This post is about what comes after the baseline: how to turn hours into a number the finance team can check and the business leader can defend in that room.
Why AI numbers lose the CFO
Most AI business cases fail in the same few ways. The hours are guesses. The percentage is high. Hours freed get called “savings,” as if cash will turn up in the bank. And somewhere in the deck, hours quietly turn into people.
A CFO has seen every one of those moves. One inflated number, and the finance team stops trusting the rest of the case.
The answer isn’t a cleverer model. It’s a plain one, with every assumption written down and every assumption set low on purpose. What follows is the method we use. It’s simple, undiscounted arithmetic, and that’s deliberate: anyone on the finance team can rebuild it in a spreadsheet and get the same answer.
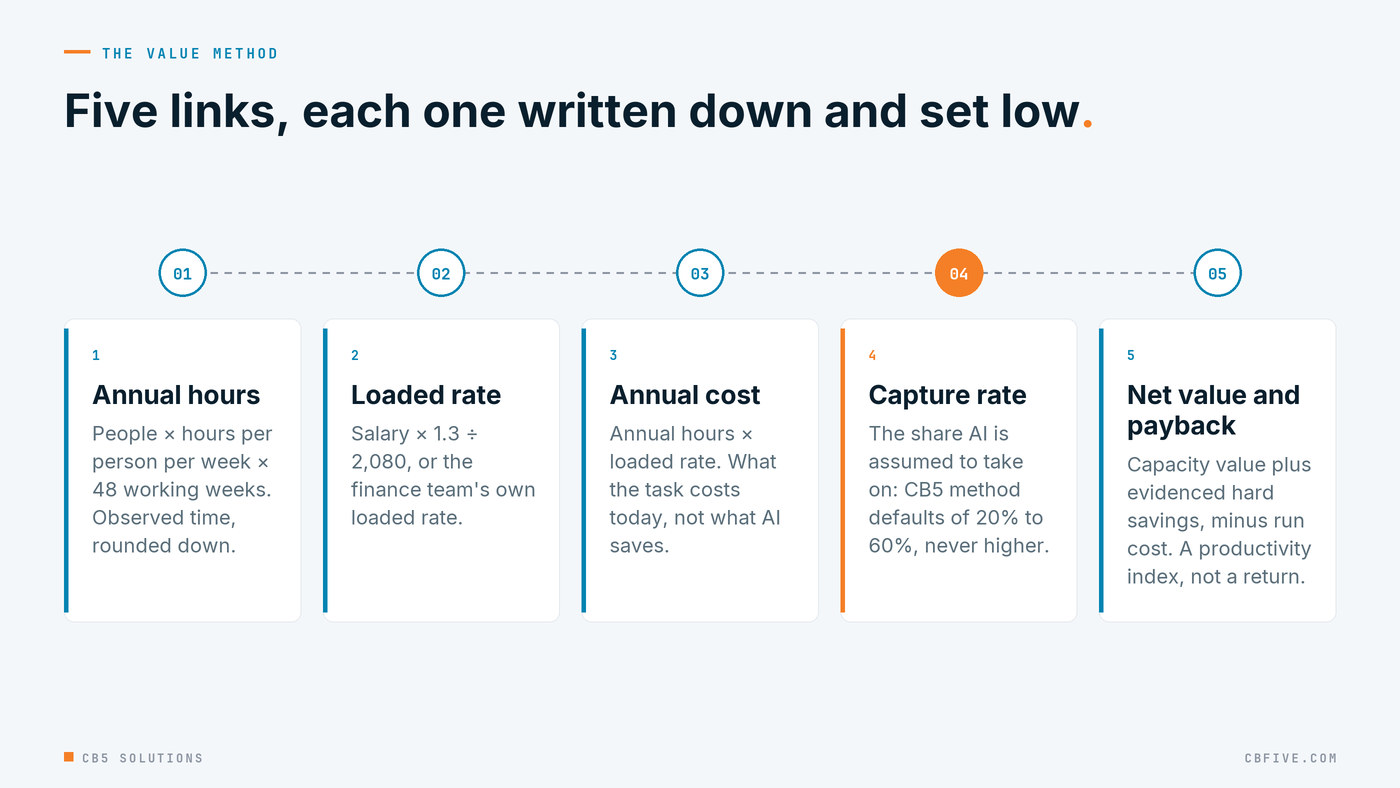
The chain, one link at a time
Start with hours.
Annual hours = people × hours per person per week × 48 working weeks. We use 48 weeks, not 52, to allow for leave and holidays.
The hours should come from the work as it actually runs: shadowing, a short time log kept by the team, or the timestamps a system already records. Observed time beats an estimate. When in doubt, round down.
Put a fair rate on an hour.
Loaded hourly rate = annual salary × 1.3 ÷ 2,080. The 1.3 adds benefits and overhead; 2,080 is the paid hours in a year. If your finance team has its own loaded rate, use theirs instead. It’s their number, so let them own it.
Annual cost = annual hours × loaded rate. That’s what the task costs today. It is not what AI will save.
Assume AI takes only part of the work.
AI doesn’t take a task off someone’s plate completely. A person still reviews the output, checks it and handles the exceptions. So we apply a capture rate: the share of the time a given kind of solution is assumed to take on. Our defaults depend on the pattern:
- General assistant help inside everyday apps: 20%
- A knowledge agent that answers questions: 40%
- Drafting first versions: 40%
- Classification and triage of incoming requests: 50%
- Workflow automation: 50%
- Reading documents such as invoices and forms: 60%
These are CB5 method defaults, not benchmarks. They aren’t a claim about what any product achieves. They’re starting points chosen to be conservative, and none goes above 60%.
Annual value = annual cost × capture rate, plus any hard savings you can evidence.
Take off what it costs to run.
A solution has running costs: licenses, platform use, support. Net annual value = annual value − annual run cost. Payback in months = one-time cost ÷ (net annual value ÷ 12). Three-year multiple = (3 × net annual value − one-time cost) ÷ one-time cost.
When the value is mostly capacity, call those last two a productivity index, not a return. A number is a return only when a budget line falls.
That’s the whole chain. Nothing in it needs a data scientist, and nothing in it hides.
Conservative by design
A formula is only as honest as what goes into it. Four habits keep the inputs honest.
Hours are rounded down, never up. Observed time is preferred over what people remember. Before anyone presents the results, the champion in each business unit, the person who runs that work, validates the people, hours, volumes and rates behind every top-ten opportunity. And each opportunity is valued once, on one pattern. If invoice reading could be framed as document processing or as workflow automation, we pick one. The same hour never gets counted twice.
A case that has been checked by the people who do the work is far harder to argue with than one built from a vendor’s slide. That validation step is also where the business leader earns the right to defend the number. It’s theirs, not ours.
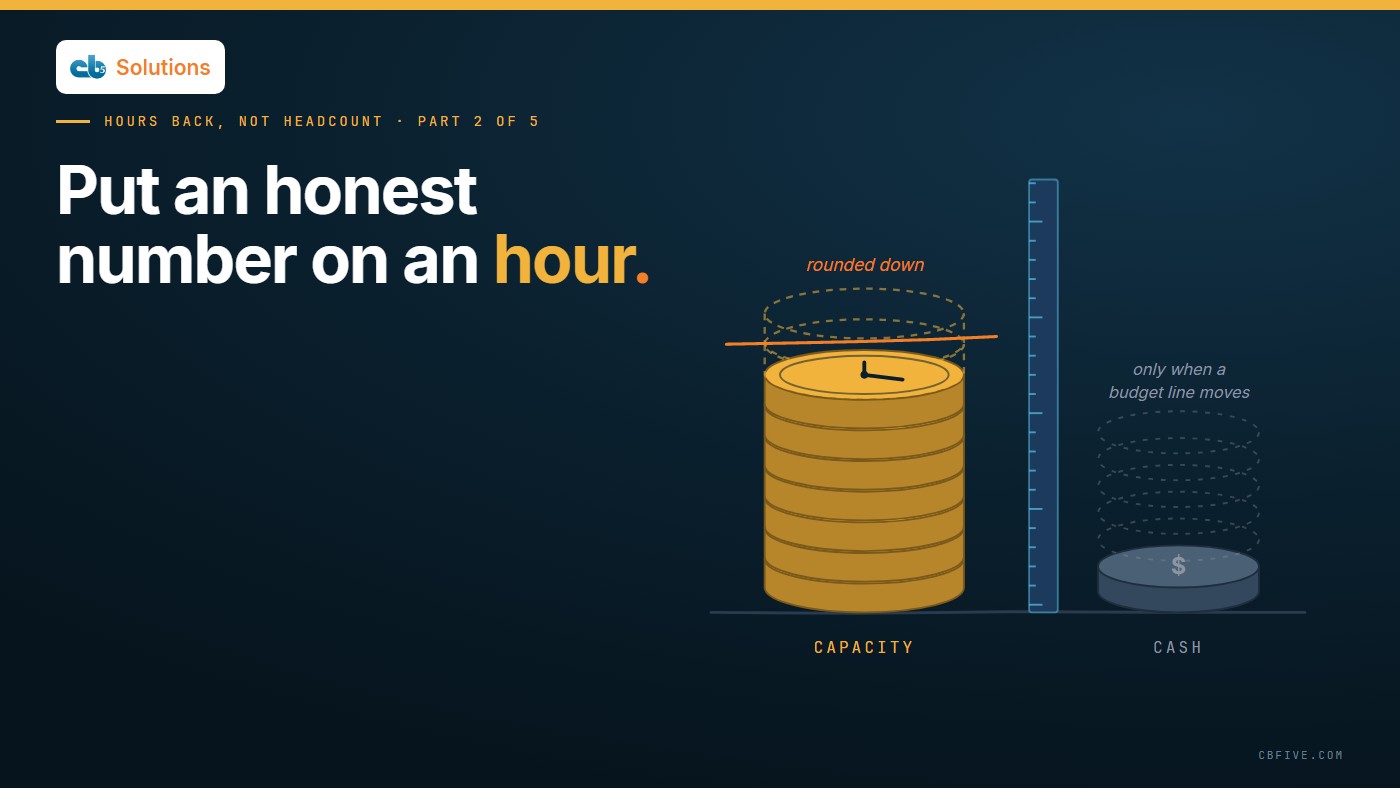
Capacity value is not cash
Capacity value is what the freed time is worth at the loaded rate. It doesn’t reduce spend on its own: payroll is the same the day after go-live as the day before. So the method keeps it on its own line, apart from hard savings, which are cash that stops leaving the business and can be proved from records finance already keeps. Soft benefits, such as fewer errors and faster answers, are described in words, not added to the dollar total. When capacity value is presented as cash, the finance team discounts everything else on the page. We’ve written about why the value lies in work absorbed, not minutes saved, and our Copilot ROI series goes deeper on keeping capacity and cash apart.
It’s also why we talk about capacity, not headcount. We don’t turn hours into roles removed. The organization decides where the hours go: a backlog cleared, quicker month-end, growth handled without burning people out.
A worked example
Here’s the arithmetic on a worked example: an accounts payable team we made up to show the method. Every figure below is invented for illustration. None is a benchmark, a client result, a quote or a license price.
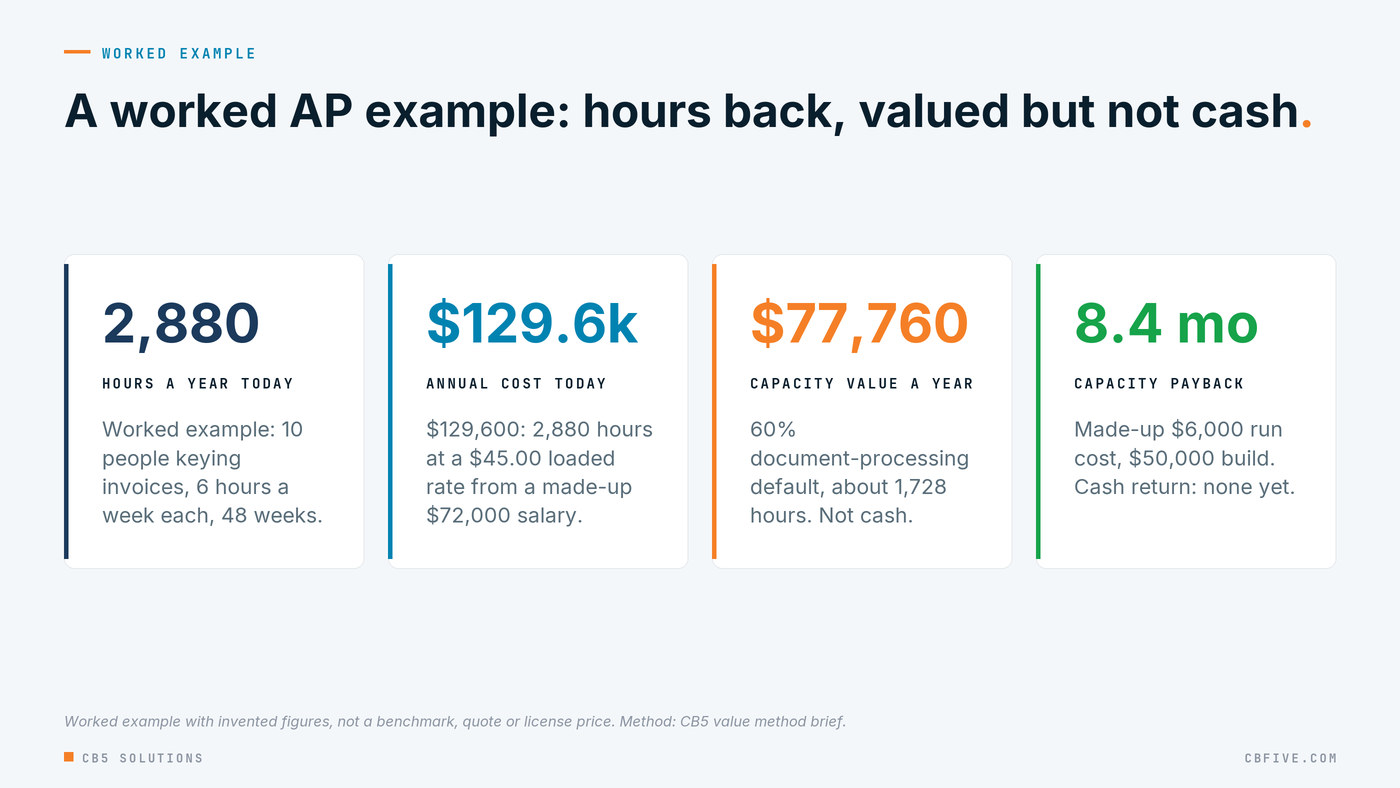
In the worked example, ten people key invoices by hand for about six hours each a week, at a salary of $72,000, so the loaded rate is $72,000 × 1.3 ÷ 2,080 = $45.00 an hour. Annual hours are 10 × 6 × 48 = 2,880, and annual cost is 2,880 × $45.00 = $129,600.
Reading invoices is document processing, so the capture rate is the 60% default, which gives a capacity value of $129,600 × 60% = $77,760 a year, or about 1,728 hours. Hard savings are $0, because none has been evidenced. With a run cost of $6,000 a year (the customer’s own software and usage cost, not a CB5 fee), net annual value is $71,760. Against a one-time build cost of $50,000, capacity payback is about 8.4 months and the three-year productivity index is 3.3x. The cash return, for now, is nothing: no budget line has moved.
Notice what the example doesn’t say. It doesn’t say the company saves cash, and it doesn’t say anyone’s job goes away. It says the team gets about 1,728 hours back, and that time is worth $77,760 at the loaded rate. It becomes cash only if the business acts on it: overtime that stops, a contractor not renewed.
Now try a stress test of your own. Halve the capture rate in the same worked example, to 30%, and capacity value falls to $38,880, net value after run cost to $32,880, and capacity payback stretches to a little over 18 months. If the opportunity is still worth doing at half the estimate, the case can survive a skeptical room.
From a model to a measurement
Everything above is a model. A pilot turns it into evidence.
Before go-live, the pilot baselines time per item, or hours per person per week, for two weeks, from the same data source it will use afterward. Then it measures for 30 days from go-live and reports the result above or below the target agreed in advance. A measured capture rate replaces the default, and the next business case starts from evidence instead of an assumption. (Our post on baselining before the pilot covers the measurement side in more depth.)
IT has a concrete part in making that number trustworthy. It grants the pilot read access to the system the measurement comes from, under named accounts and only the access the work needs. It confirms the run-cost line, because licenses, platform use and support sit in its budget. And it holds the line on how people are measured: no monitoring software, no individual performance reporting, team-level numbers from the same source before and after. The business owns the outcome; IT makes sure the evidence for it is clean.
Run your own numbers
Pick one task in one team. How many people do it, for how many hours a week, at what salary, and what kind of solution would take it on? Our Hours Back Calculator uses this same method and shows the hours back, what that time is worth at the loaded rate, and the payback after run cost.
For your finance team, the value method brief sets out every formula, the capture defaults and the worked example, so they can check it line by line.
CB5 Solutions helps organizations understand the layers of AI, get the most from what they buy, and build an AI program that pays back inside their IT standards. We start every engagement with one business problem and a governance baseline. Let’s pick yours.
Next in the series: What an AI Business Analyst actually does, the missing role between the team doing the work and IT.