
We keep getting asked some version of “how do we show the board this is working?” It usually comes up about six months into an AI rollout, when most leadership teams get the same report. Active users are up, prompts per week are up, and a chart shows Copilot usage climbing steadily across every department. It looks like success, and it gets presented that way.
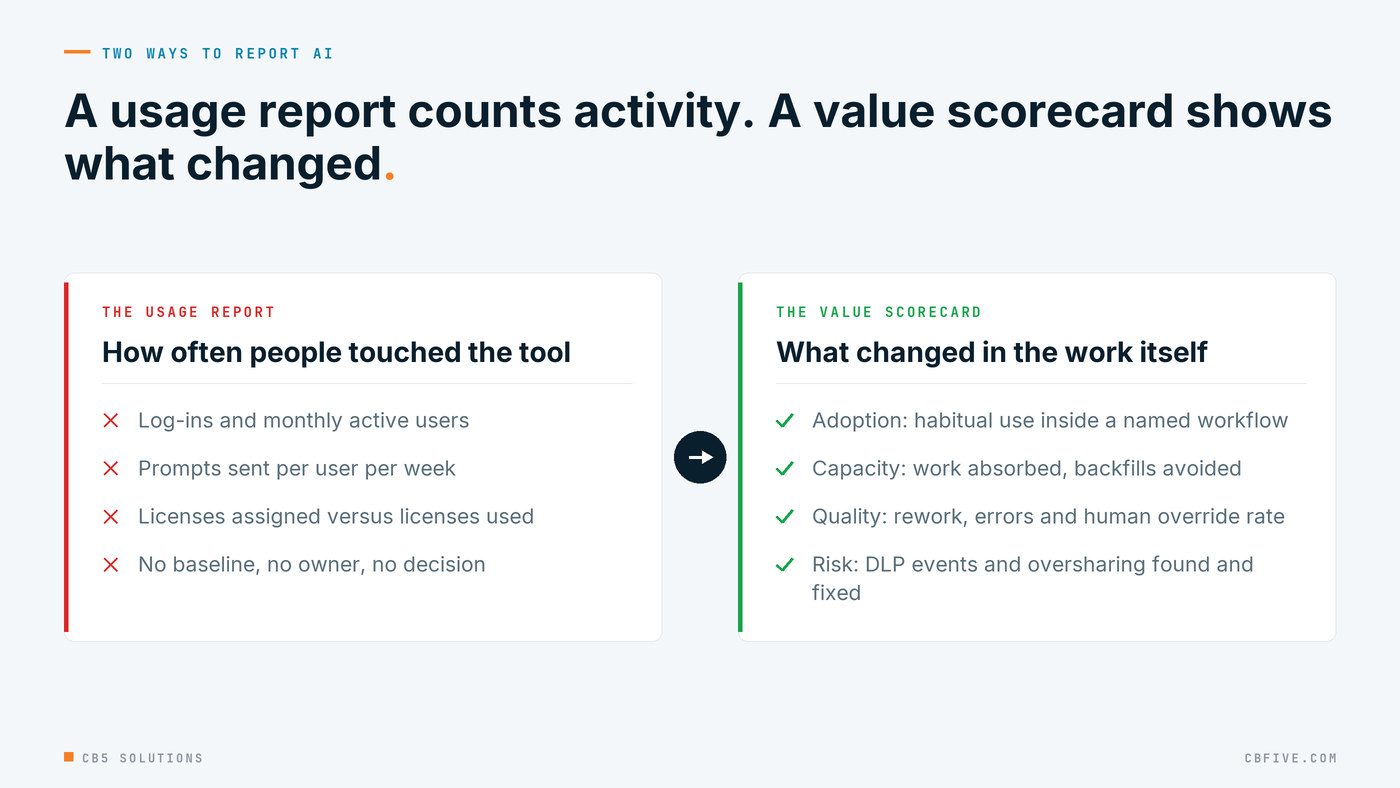
Then a board member asks the question the report can’t answer: what did we get for it? They’re not asking how many people used it. They want to know what changed in the cost of running the organization, and the usage report doesn’t have much to say, because it was never built to answer that. Log-ins, prompts and active users measure activity, and we’ve found they tell you very little about value.
This is the last post in our eight-part series, and we wanted to finish with the piece that holds the rest together: a one-page AI value scorecard, reported monthly, that a board can actually trust.
Why the Usage Report Is the Wrong Report
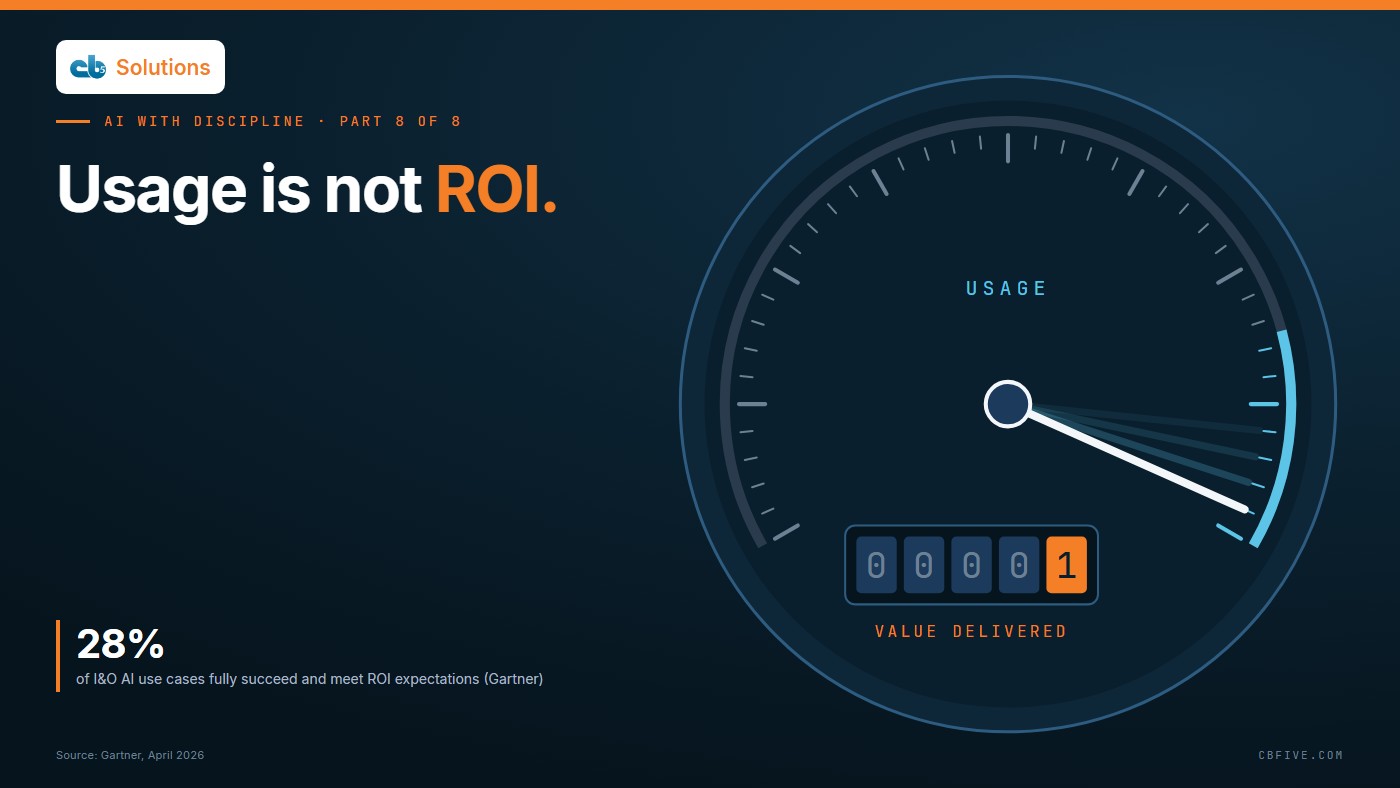
The evidence says the gap between activity and value is wide. A Gartner survey of IT infrastructure and operations leaders in April 2026 found only 28% of AI use cases in that area fully succeed and meet ROI expectations. From what we see, those programs usually have plenty of usage. What they’re missing is proof.
The upside is real when someone measures it. IDC and Microsoft measured a 3.7x average return on generative-AI investment, a 2024 figure that shows what well-run programs can do. With that said, it’s worth setting that next to a reality check. The San Francisco Fed noted in February 2026 that macro studies still find limited aggregate productivity effects from AI. Returns across a whole enterprise take time, and they only show up where the work itself changed.
That’s our issue with a usage dashboard. It can’t tell a team that redesigned its month-end close from a team that uses Copilot to rewrite emails, because in the telemetry they look the same.
One Page, Four Lenses
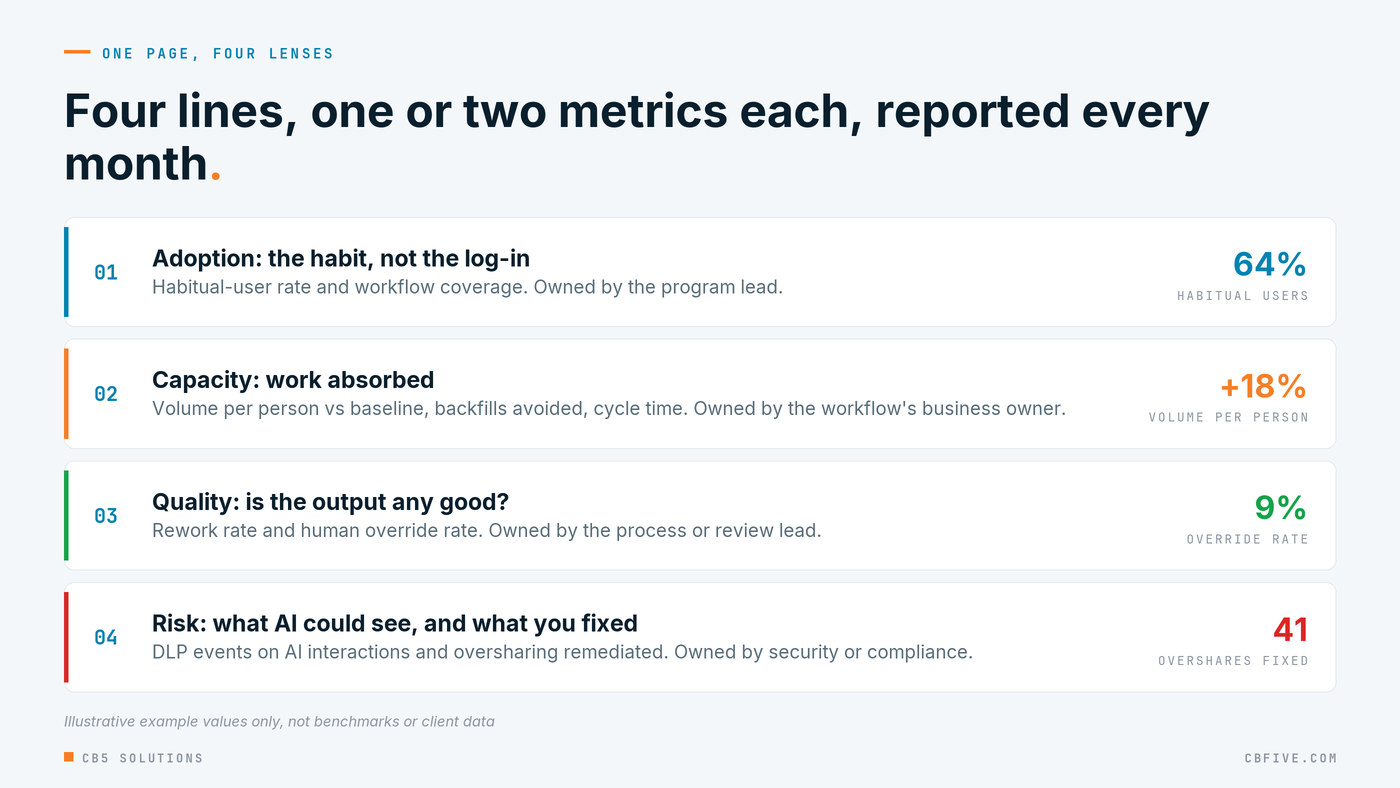
The scorecard we build with the organizations we work with fits on one page and looks at the program four ways. Each lens gets one or two metrics. Any more than that and, in our experience, nobody reads it.
Adoption: the habit, not the log-in. Someone who tried Copilot once in March counts as “active” in most reports, which doesn’t tell you much. Let’s start instead with the habitual-user rate: the share of licensed people using AI on most working days. Then measure workflow coverage: of the tasks in the target workflow, how many now start with an AI draft? Habit inside a named workflow is the early signal we’d pay attention to.
Capacity: work absorbed. This is the lens from part two of the series. Track volume handled per person against the pre-rollout baseline, and record every backfill avoided, meaning the departure or retirement that didn’t need replacing because the team took on the work. Add cycle time for the target workflow. These are the numbers that show up in an operating budget.
Quality: is the output any good? Faster work that comes back for correction doesn’t really count as a gain. Track the rework or error rate on AI-assisted output against the baseline, and track the human override rate too: how often the reviewer rejects or heavily rewrites what the AI prepared. A falling override rate means the agent is earning trust, and a rising one is an early warning.
Risk: what the AI could see, and what you fixed. Track DLP events on AI interactions, and oversharing found and fixed: overshared sites, stale permissions and unlabeled sensitive content cleaned up as a direct result of the program. Note any incidents. A good risk line often gets busier early on, because you’re finding what was already there. This is the line IT owns. Security, compliance and auditing are the guardrails that let the business keep building safely, so a busy risk line is progress, and we think the board should hear it put that way.
Set the Baseline Before You Switch Anything On
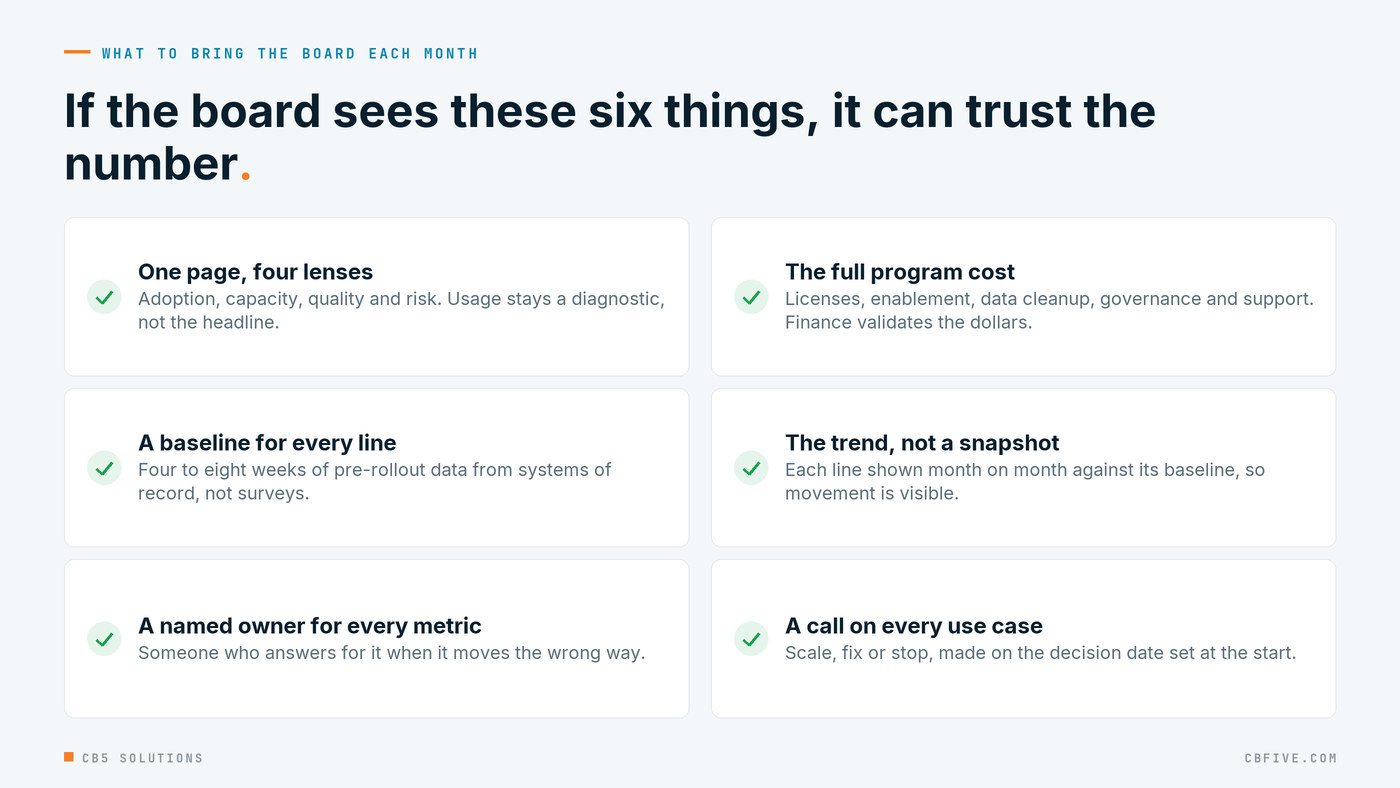
A scorecard without a baseline ends up being a second usage report. The most common reason we see AI value go unproven is that nobody measured the work before the AI showed up, and you can’t rebuild that afterwards.
Capture four to eight weeks of how things run today. Volume per person, cycle time and rework rate for each target workflow, pulled from systems of record wherever you can rather than from surveys.
Use a comparison group when you can. A team doing the same work without AI, over the same period, is the cleanest answer to “would this have happened anyway?”
Count the full cost. Licenses are the part everyone sees, and they’re worth a second look: every AI platform has layers, and most programs pay for tiers no workflow on the scorecard uses while missing the one the work actually needs. Beyond licenses, enablement, data cleanup, governance tooling, support and the time spent reporting are all program costs too. ROI is benefits minus the full cost, divided by the full cost. Anything less makes the result look better than it is, and boards notice. Our Copilot ROI series, starting October 20, shows how to count enablement and keep freed hours apart from cash.
Every Line Has an Owner
A metric without an owner tends to get reported and ignored. Each line on the scorecard needs a named person who answers for it when it moves the wrong way.
The business owner of each workflow owns capacity, since they run the work, chose the problem and know whether volume really moved. Finance checks any dollar figure before it reaches the board. The process owner or review lead owns quality, because their team sees the overrides. The security or compliance lead in IT owns risk. The program lead owns adoption, working through champions. And an executive sponsor owns the page and the decisions that come out of it.
We’d think of that structure as governance rather than paperwork: the business drives the lines that measure value, and IT owns the guardrails that keep it safe. Gartner found in February 2026 that organizations using dedicated AI governance platforms are 3.4x more likely to achieve highly effective AI governance, and named owners on the scorecard are where that governance shows up day to day.
From Scorecard to Decision: Scale, Fix or Stop
The whole point of the scorecard is to force decisions. Report it monthly, read it against the decision date you set when each pilot started, and it points to one of three moves.
Scale when adoption and capacity both move and quality and risk hold steady. That’s your evidence that a workflow has actually changed, beyond how much a tool gets used.
Fix when the lenses disagree. High adoption with flat capacity usually means people are using AI but nobody redesigned the work, and we see that one a lot. A rising override rate means the agent or its data needs attention before more users see it.
Stop when nothing’s moved by the decision date. We don’t see stopping as failure. It frees up budget and attention for a workflow that will pay, and it’s the decision trend-driven programs never seem to make.
The Series in One Page
Eight posts, one argument: AI creates value when it is applied with discipline, not when it is pursued as a trend.
- AI With Discipline — adoption is universal, payoff is rare, and the gap is discipline.
- “Time Back” Is Not the ROI — measure work absorbed, not minutes saved.
- It’s Rarely the Model — programs fail on ownership, process, data or measurement.
- Copilot Inherits Your Permissions — fix data access before you deploy.
- AI or Process? — five questions before you fund anything.
- Start Where the Work Is Boring — pick repetitive, high-volume first use cases.
- AI Prepares, a Human Decides — the agent pattern that survives an audit.
- Usage Is Not ROI — a one-page scorecard that proves value monthly.
Every one of them comes back to the question we put to every leadership team, and it’s the one a scorecard should answer.

Getting Started
If your AI reporting today is mostly a usage dashboard, these are the steps we’d take first:
- Retire usage as the headline. Keep it as a diagnostic, but stop presenting active users as the result.
- Pick one or two metrics per lens for each live workflow, and put them on a single page.
- Capture a baseline for every new use case before it goes live, and record the full program cost.
- Name an owner for every line, plus an executive sponsor for the page.
- Report monthly and decide quarterly. Every use case gets a scale, fix or stop call on its decision date.
Talk to Us
CB5 Solutions helps organizations understand the layers of AI, get the most from what they buy, and build an AI program that pays back inside their IT standards. We start every engagement with one business problem and a governance baseline. Let’s pick yours.
That’s the series. If you are joining at the end, start with part 1: AI With Discipline: Why Adoption Is Universal and Payoff Is Rare.